Distributed Training aims to reduce the time to train an model in machine learning, by splitting the training workload across multiple nodes. It has gained in importance as data sizes, model sizes and complexity of training have grown. Training consists of iteratively minimizing an objective function by running the data through a model and determining a) the error and the gradients with which to adjust the model parameters (forward path) and b) the updated model parameters using calculated gradients (reverse path). The reverse path always requires synchronization between the nodes, and in some cases the forward path also requires such communication.
There are three approaches to distributed training – data parallelism, model parallelism and data-model parallelism. Data parallelism is the more common approach and is preferred if the model fits in GPU memory (which is increasingly hard for large models).
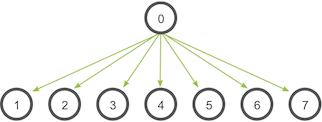
In data parallelism, we partition the data on to different GPUs and and run the same model on these data partitions. The same model is present in all GPU nodes and no communication between nodes is needed on the forward path. The calculated parameters are sent to a parameter server, which averages them, and updated parameters are retrieved back by all the nodes to update their models to the same incrementally updated model.
In model parallelism, we partition the model itself into parts and run these on different GPUs. This applies to large models such as large language models (LLMs) that do not fit in a single GPU.
A paper on Parameter Servers is here, on Scaling Distributed Machine Learning with the Parameter Server.
To communicate the intermediate results between nodes the MPI primitives are leveraged, including AllReduce.
The amount of training data for BERT is ~600GB. BERT-Tiny model is 17MB, BERT-Base model is ~400MB. During training a 16GB memory GPU sees an OOM error.
Some links to resources –
https://andrew.gibiansky.com/blog/machine-learning/baidu-allreduce/
https://github.com/horovod/horovod/blob/master/docs/concepts.rst (Horovod, an open source parameter server).
https://docs.aws.amazon.com/sagemaker/latest/dg/distributed-training.html
https://openai.com/blog/scaling-kubernetes-to-2500-nodes/
https://mccormickml.com/2019/11/05/GLUE/ Origin of General Language Understanding Evaluation.
https://github.com/google-research/bert
https://towardsdatascience.com/model-parallelism-in-one-line-of-code-352b7de5645a
Horovod core principles are based on the MPI concepts size, rank, local rank, allreduce, allgather, and broadcast. These are best explained by example. Say we launched a training script on 4 servers, each having 4 GPUs. If we launched one copy of the script per GPU:
- Size would be the number of processes, in this case, 16.
- Rank would be the unique process ID from 0 to 15 (size – 1).
- Local rank would be the unique process ID within the server from 0 to 3.
- Allreduce is an operation that aggregates data among multiple processes and distributes results back to them. Allreduce is used to average dense tensors. Here’s an illustration from the MPI Tutorial:
- Allgather is an operation that gathers data from all processes in a group then sends data back to every process. Allgather is used to collect values of sparse tensors. Here’s an illustration from the MPI Tutorial:
- Broadcast is an operation that broadcasts data from one process, identified by root rank, onto every other process. Here’s an illustration from the MPI Tutorial:

Horovod switched from using MPI to using NCCL (NVidia Collective Communications Library) for distributing initial weights and biases, and intermediate weights and biases after each training step .
NCCL is a library that provides primitives for communication between multiple GPUs both within a node and across different nodes.
Horovod continues to use MPI for other functions that do not involve inter-GPU communication, such as informing processes on different nodes of their id (aka rank), master vs non-master status for coordination between processes and for sharing the total number of nodes.
NVidia NCCL uses NVLink which is the hardware interconnect that connects multiple GPUs.
NVLink is a high-speed, point-to-point interconnect technology developed by NVIDIA that is designed to enable high-bandwidth communication between processors, GPUs, and other components in a system.
NVLink 1.0, which was introduced in 2016, provides a maximum bidirectional bandwidth of 80 GB/s per link. This means that data can be transferred between two devices at a rate of up to 80 GB/s in each direction.
NVLink 2.0, which was introduced in 2017, provides a maximum bidirectional bandwidth of 300 GB/s per link. This represents a significant increase in bandwidth compared to NVLink 1.0, and allows for even faster data transfer rates between devices.
NVLink 3.0, which was introduced in 2021, provides a maximum bidirectional bandwidth of 600 GB/s per link, making it the fastest version of NVLink to date.